The Future of Retail: Embracing Innovation
Embracing innovation is not just a choice but a necessity for retailers navigating through changing customer preferences, technological advancements,...


In today's fast-paced business world, making informed decisions is essential for success. Every piece of data holds valuable insights that can steer your company in the right direction. However, sifting through mountains of raw data can be overwhelming. This is where Microsoft Power BI, one of the leading data visualization tools, comes to the rescue, offering a powerful solution for transforming data into actionable insights. Let’s start with What is Power BI before getting into details.
Microsoft Power BI is a comprehensive data analytics tool designed to empower businesses with the ability to transform complex data into easily understandable visuals. From interactive charts and graphs to user-friendly dashboards, Power BI simplifies the process of deriving meaningful insights from your data and allowing you to share it with others. Power BI uses machine learning to predict future trends, helping users prepare for future demands and make informed decisions.
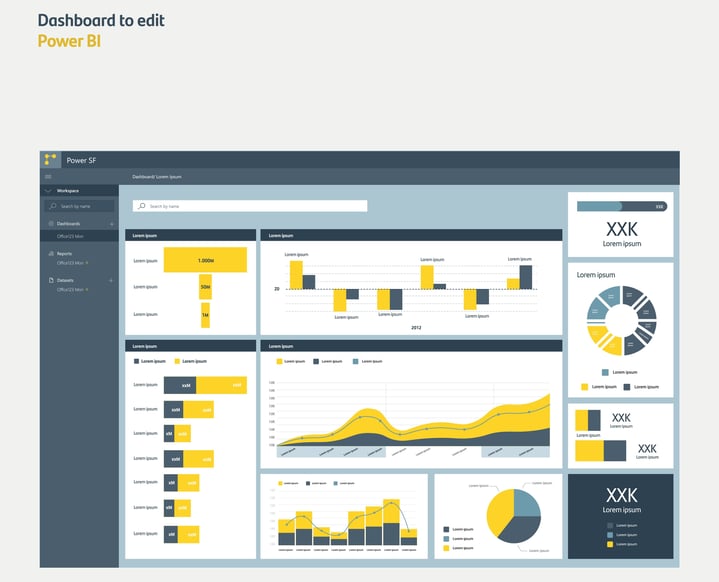
Picture this: instead of poring over spreadsheets and endless rows of numbers, you have visually stunning charts, graphs, and dashboards that instantly convey the story hidden within your data. That's the magic of Microsoft Power BI, a comprehensive data analytics tool that empowers users to create visual representations that are not only easy to interpret but also a joy to work with.
At its core, Power BI is a crucial component of Microsoft Business Intelligence (BI) software, designed specifically to support data-driven decision-making. It offers real-time data analysis and visualization capabilities that are invaluable for businesses striving to stay competitive in today's dynamic markets. As part of the Microsoft Power Platform, alongside Power App and Power Automate, Power BI seamlessly integrates with other Microsoft tools, providing a holistic solution for business management.
Business intelligence is all about transforming raw data into meaningful, actionable insights. With Power BI, this transformation becomes not just possible but remarkably straightforward. Imagine having a tool that automates the four essential stages of BI: gathering information, integrating data, creating comprehensive reports, and producing easily digestible results.
What sets Power BI apart is its ability to make data understandable, reliable, and meaningful for more effective decision-making. It doesn't matter if you're dealing with data from various departments; Power BI can centralize and model it, turning it into a powerful decision-support tool that's readily accessible to your team.
One of the standout features of Power BI is its user-friendliness. You don't need a degree in data science to navigate and utilize this powerful BI solution. Accessing data is as simple as a few clicks, and every user can customize their analysis based on their role and responsibilities.
Customized Power BI dashboards enable users to see precisely the data that matters to them, promoting efficiency and informed decision-making. Moreover, Power BI fosters collaboration by making it easy for teams to work on data simultaneously, even from different locations. Rest assured, all data access is secure and protected, ensuring the integrity of your information.
Power BI also offers mobile accessibility, allowing your teams to access critical data and insights from anywhere, at any time. This level of flexibility saves time and empowers agile teams.
While the capabilities of Power BI are undoubtedly impressive, effective data visualization is an art that can greatly enhance your decision-making processes. Here are some tips to make the most of Power BI:
Microsoft Power BI is a game-changer when it comes to unlocking business insights and enabling data-driven decision-making. Its capabilities in data visualization, analysis, and sharing are a valuable asset for businesses of all sizes. Whether you're dealing with large datasets, complex reporting needs, or simply aiming to make data-driven decisions, Power BI is your trusted partner on the journey to business success.
We're here to assist you in setting up Power BI. Our team of experienced Power BI consultants is ready to provide you with expert guidance. If you're interested in exploring the integration of Power BI with ERP and CRM solutions, don't hesitate to get in touch with Tenging to gain further insights and guidance.
Embracing innovation is not just a choice but a necessity for retailers navigating through changing customer preferences, technological advancements,...
In the evolving world of business, effective inventory and warehouse management system play pivotal roles in driving operational efficiency and...
The importance of cyber security cannot be overstated. Cybersecurity is the shield against digital threats, spanning business and mobile computing....